Mastering Geospatial Data Visualization: A Comprehensive Journey with Kepler.gl
The Fascinating World of Geospatial Visualization
Imagine standing at the intersection of technology and geography, where every data point tells a story, and every map reveals hidden patterns. This is the magical realm of geospatial visualization – a domain where complex spatial information transforms into breathtaking, interactive experiences.
My Personal Expedition into Spatial Data
When I first encountered geospatial visualization, it felt like discovering a secret language. Data wasn‘t just numbers anymore; it became a living, breathing narrative of human movement, environmental changes, and complex interactions.
The Evolution of Geographical Data Representation
Geographical data representation has undergone a remarkable transformation. From hand-drawn maps to satellite imagery, and now to interactive, real-time visualizations, our understanding of spatial information has dramatically expanded.
Technological Milestones
Before tools like Kepler.gl emerged, geospatial visualization was a complex, time-consuming process. Researchers and analysts spent countless hours manually plotting points, creating static representations that barely captured the dynamic nature of spatial data.
Understanding Kepler.gl: More Than Just a Visualization Tool
Kepler.gl isn‘t merely a library; it‘s a revolutionary approach to understanding geographical information. Developed by Uber‘s visualization team, this tool represents a quantum leap in how we interact with spatial data.
The Technical Architecture
At its core, Kepler.gl is built on deck.gl, a WebGL-powered visualization framework. This means it can handle massive datasets with incredible performance, rendering complex geospatial visualizations in real-time.
Practical Implementation: A Deep Dive
Setting Up Your Geospatial Exploration Environment
To begin your journey, you‘ll need a robust Python environment. While the installation might seem straightforward, the real magic lies in understanding how different components interact.
# Advanced environment setup
import sys
import pandas as pd
import geopandas as gpd
from keplergl import KeplerGl

# Recommended configuration checks
def validate_geospatial_environment():
    required_versions = {
        ‘pandas‘: ‘1.3.0‘,
        ‘geopandas‘: ‘0.10.0‘,
        ‘keplergl‘: ‘0.2.0‘
    }

    # Comprehensive version compatibility check
    for library, version in required_versions.items():
        if not check_library_version(library, version):
            raise EnvironmentError(f"Incompatible {library} version")
Advanced Visualization Strategies
Computational Complexity in Spatial Rendering
Rendering geospatial data isn‘t just about plotting points. It involves complex computational processes that consider:
- Coordinate transformation
- Projection algorithms
- Performance optimization
- Real-time data processing
Machine Learning Integration Techniques
Modern geospatial visualization transcends traditional mapping. By integrating machine learning algorithms, we can:
- Predict spatial trends
- Identify complex patterns
- Generate predictive geographical models
Real-World Application Scenarios
Urban Planning and Transportation
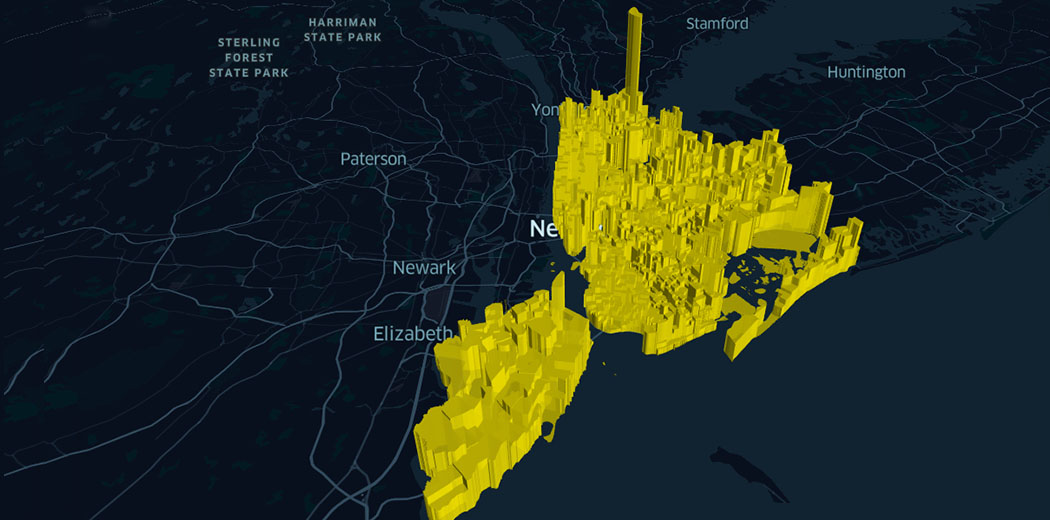
Consider how a city like New York uses geospatial visualization. By analyzing taxi trip data, urban planners can:
- Optimize transportation routes
- Understand traffic flow patterns
- Make data-driven infrastructure decisions
Environmental Monitoring
Geospatial tools enable environmental scientists to track:
- Climate change impacts
- Deforestation rates
- Wildlife migration patterns
Performance Optimization Strategies
Handling Large-Scale Datasets
When dealing with massive geospatial datasets, performance becomes crucial. Kepler.gl offers several optimization techniques:
- Data Preprocessing
- Efficient Memory Management
- Intelligent Rendering Techniques
def optimize_geospatial_dataset(dataframe):
    # Advanced data reduction techniques
    reduced_dataframe = dataframe.sample(n=10000)

    # Spatial indexing
    spatial_index = reduced_dataframe.sindex

    return reduced_dataframe
Future of Geospatial Visualization
The future isn‘t just about better tools; it‘s about creating more intelligent, predictive systems that can understand and anticipate spatial dynamics.
Emerging Technological Frontiers
- Artificial Intelligence Integration
- Real-time Global Data Synchronization
- Augmented Reality Geographical Interfaces
Conclusion: Beyond Visualization
Geospatial visualization with Kepler.gl is more than a technical skill – it‘s a lens through which we can understand our world‘s complex, interconnected systems.
As you embark on this journey, remember: every data point tells a story. Your job is to listen, analyze, and reveal the hidden narratives within spatial information.
Your Next Steps
- Experiment fearlessly
- Challenge conventional visualization methods
- Never stop exploring
The world of geospatial data awaits your unique perspective.