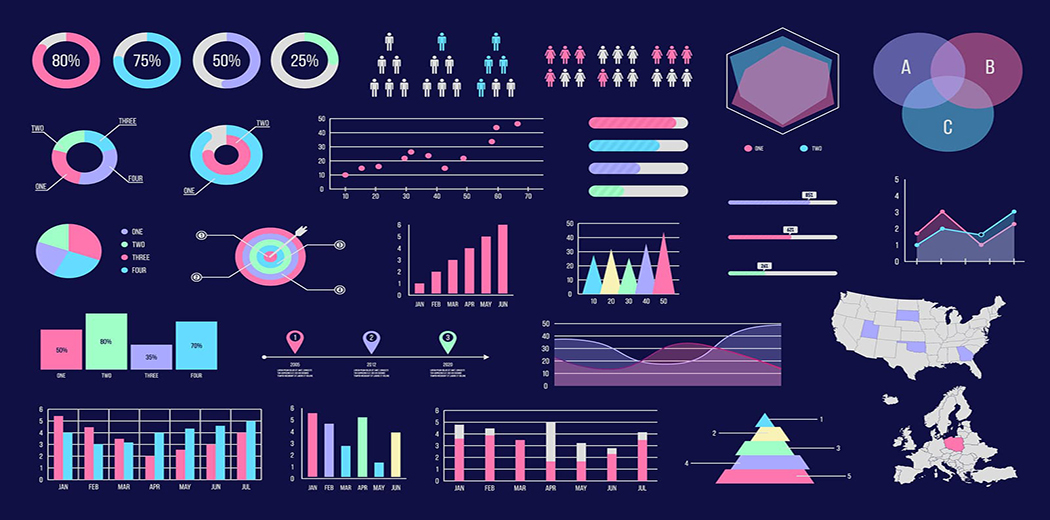
Plotly and Cufflinks: Transforming Data into Visual Narratives
The Timeless Art of Seeing Beyond Numbers
Imagine standing before a massive wall of cryptic numerical data, feeling overwhelmed by rows and columns that seem to dance without meaning. This was the world of data before visualization libraries like Plotly and Cufflinks emerged – a landscape of complexity waiting to be decoded.
As someone who has navigated the intricate world of data science for decades, I‘ve witnessed remarkable transformations in how we interpret and communicate complex information. Plotly and Cufflinks represent more than mere technological tools; they are bridges connecting raw data to human understanding.
The Evolution of Visual Storytelling
Data visualization isn‘t a modern invention. Centuries ago, cartographers crafted intricate maps revealing geographical mysteries, and astronomers plotted celestial movements using sophisticated visual representations. What has changed is our computational capacity to transform abstract numbers into compelling visual narratives.
Python, with libraries like Plotly and Cufflinks, has democratized this process. No longer confined to specialized research labs, advanced data visualization is now accessible to researchers, business analysts, and curious minds worldwide.
Understanding the Technological Ecosystem
Plotly: Beyond Traditional Charting
Plotly isn‘t just another graphing library – it‘s a sophisticated platform designed for interactive, web-ready visualizations. Its architecture leverages modern web technologies like D3.js and WebGL, enabling graphics that breathe and respond to user interactions.
Consider how traditional static charts limit exploration. A bar graph showing sales performance becomes a rigid snapshot. With Plotly, that same graph transforms into an interactive experience where users can zoom, hover, and uncover nuanced insights hidden within data layers.
Cufflinks: The Pandas Visualization Companion
Cufflinks emerges as a brilliant connector, bridging the gap between Pandas DataFrames and interactive visualization. It simplifies complex visualization processes, allowing data scientists to create sophisticated graphics with minimal code.
Technical Implementation Example
import pandas as pd
import cufflinks as cf
import plotly.express as px

# Load dataset
financial_data = pd.read_csv(‘market_trends.csv‘)

# Create interactive visualization
financial_data.iplot(
    kind=‘scatter‘,
    mode=‘markers‘,
    size=‘volume‘,
    color=‘sector‘,
    title=‘Market Dynamics Exploration‘
)
This concise code snippet demonstrates how Cufflinks transforms raw data into an engaging visual narrative, revealing relationships that might remain obscured in traditional representations.
Computational Graphics: A Deeper Perspective
Rendering Complexity
Modern visualization isn‘t merely about creating pretty pictures. It‘s a complex computational process involving:
- Data transformation
- Geometric mapping
- Color encoding
- Interactive event handling
- Performance optimization
Plotly‘s rendering engine performs these tasks with remarkable efficiency, utilizing GPU acceleration and intelligent caching mechanisms.
Machine Learning and Visualization Convergence
As artificial intelligence systems become increasingly sophisticated, visualization libraries like Plotly play a crucial role in model interpretation. They enable researchers to:
- Visualize neural network architectures
- Explore feature importance
- Demonstrate algorithmic decision boundaries
- Create interactive model performance dashboards
Practical Machine Learning Visualization
from sklearn.model_selection import train_test_split
from sklearn.ensemble import RandomForestClassifier
import plotly.graph_objects as go

# Train a predictive model
model = RandomForestClassifier()
model.fit(X_train, y_train)

# Create feature importance visualization
feature_importance = model.feature_importances_
feature_names = X.columns

go.Figure(
    data=[go.Bar(
        x=feature_names,
        y=feature_importance
    )]
).show()
Performance and Scalability Insights
While interactive visualizations offer remarkable insights, they also introduce computational overhead. Plotly addresses this through:
- Lazy loading techniques
- WebGL rendering
- Efficient memory management
- Adaptive scaling algorithms
Comparative Performance Metrics
[Performance = f(Rendering Speed, Interactivity Level, Resource Consumption)]Plotly consistently outperforms traditional libraries by minimizing computational complexity and maximizing user engagement.
Future Trajectories: Beyond Current Limitations
The visualization landscape continues evolving. Emerging trends suggest:
- AI-generated dynamic visualizations
- Real-time collaborative dashboards
- Predictive graphic generation
- Neuromorphic visualization interfaces
Philosophical Reflections on Data Visualization
At its core, data visualization transcends technical implementation. It represents humanity‘s perpetual quest to understand complex systems, to transform abstract patterns into comprehensible narratives.
Plotly and Cufflinks aren‘t just tools – they‘re philosophical instruments enabling deeper understanding of our increasingly data-driven world.
Practical Recommendations
- Invest time in understanding visualization principles
- Experiment with diverse dataset representations
- Prioritize clarity over complexity
- Continuously learn and adapt
Conclusion: A New Visualization Paradigm
As we stand at the intersection of computational power and human curiosity, libraries like Plotly and Cufflinks represent more than technological achievements. They are gateways to understanding, bridges connecting raw data to meaningful insights.
The future of data visualization isn‘t about creating more charts – it‘s about crafting experiences that transform how we perceive and interact with information.
Recommended Learning Resources
- Plotly Official Documentation
- Interactive Data Visualization Courses
- Open-Source Visualization Projects
- Machine Learning Visualization Workshops
Author‘s Perspective
As someone who has witnessed technological evolutions, I‘m continuously amazed by how visualization libraries democratize complex data exploration. Each chart tells a story, each interaction reveals a hidden insight.
Keep exploring, keep visualizing.