Uber‘s Kepler.gl: Revolutionizing Location Data Analysis Through Open-Source Innovation
The Geospatial Revolution: A Personal Journey into Location Intelligence
Imagine standing at the crossroads of technological innovation, where complex geographical data transforms from abstract numbers into vivid, meaningful visualizations. This is the world Uber‘s Kepler.gl has created – a remarkable platform that democratizes location intelligence without requiring advanced coding skills.
The Genesis of Geospatial Understanding
My fascination with location data began during a research project tracking urban migration patterns. Traditional Geographic Information Systems (GIS) were complex, expensive, and required specialized training. Analysts spent weeks wrestling with intricate software, struggling to extract meaningful insights.
Kepler.gl represents a paradigm shift in this landscape. It‘s not just a tool; it‘s a gateway that allows professionals, researchers, and curious minds to explore geographical data with unprecedented ease and sophistication.
Technical Architecture: The Heart of Kepler.gl
Decoding the Technological Marvel
At its core, Kepler.gl is a masterpiece of modern web technologies. Built atop Uber‘s deck.gl framework, it leverages WebGL for high-performance rendering, React for flexible user interfaces, and Redux for robust state management.
The platform‘s architecture is designed to handle massive geospatial datasets seamlessly. By utilizing GPU acceleration, Kepler.gl can process millions of data points in real-time, transforming complex geographical information into intuitive, interactive visualizations.
Performance Under the Hood
Modern web browsers have become incredibly powerful computational environments. Kepler.gl exploits this potential through advanced rendering techniques that distribute computational load across graphics processors. This means you can visualize intricate datasets that would have previously required specialized supercomputing resources.
Real-World Impact: Beyond Simple Mapping
Transforming Industries Through Location Intelligence
Kepler.gl isn‘t just a technological marvel; it‘s a catalyst for innovation across multiple sectors. Let me share a compelling narrative that illustrates its transformative potential.
Consider urban planners in a mid-sized city struggling to optimize public transportation routes. Traditional methods involved complex statistical modeling and expensive consulting services. With Kepler.gl, city officials can now:
- Import passenger movement data
- Visualize travel patterns in real-time
- Identify inefficient routes
- Make data-driven infrastructure decisions
The result? More efficient public transportation, reduced carbon emissions, and improved citizen experience.
Machine Learning and Predictive Analytics
The Next Frontier of Geospatial Intelligence
As an AI and machine learning expert, I‘m particularly excited about Kepler.gl‘s potential for predictive analytics. By integrating machine learning models with geospatial visualizations, we can move beyond descriptive analysis into predictive and prescriptive domains.
Imagine training a neural network on historical traffic data, then using Kepler.gl to visualize potential future congestion patterns. This isn‘t science fiction – it‘s emerging reality.
Practical Implementation Strategies
Navigating the Kepler.gl Ecosystem
While Kepler.gl appears deceptively simple, mastering its capabilities requires strategic approach:
Data Preparation Techniques
Successful geospatial visualization starts long before you import your first dataset. Clean, structured data is crucial. Spend time standardizing coordinate systems, removing outliers, and ensuring consistent formatting.
Visualization Best Practices
- Use color gradients to represent additional data dimensions
- Leverage time-based animations for dynamic datasets
- Experiment with layer transparency to reveal complex relationships
Technological Limitations and Future Outlook
No technology is perfect, and Kepler.gl is no exception. Current limitations include:
- Browser dependency
- Performance challenges with extremely large datasets
- Limited offline capabilities
However, the open-source nature of the project means continuous improvement driven by a global community of developers and researchers.
The Human Element in Data Visualization
Beyond Numbers: Telling Stories with Data
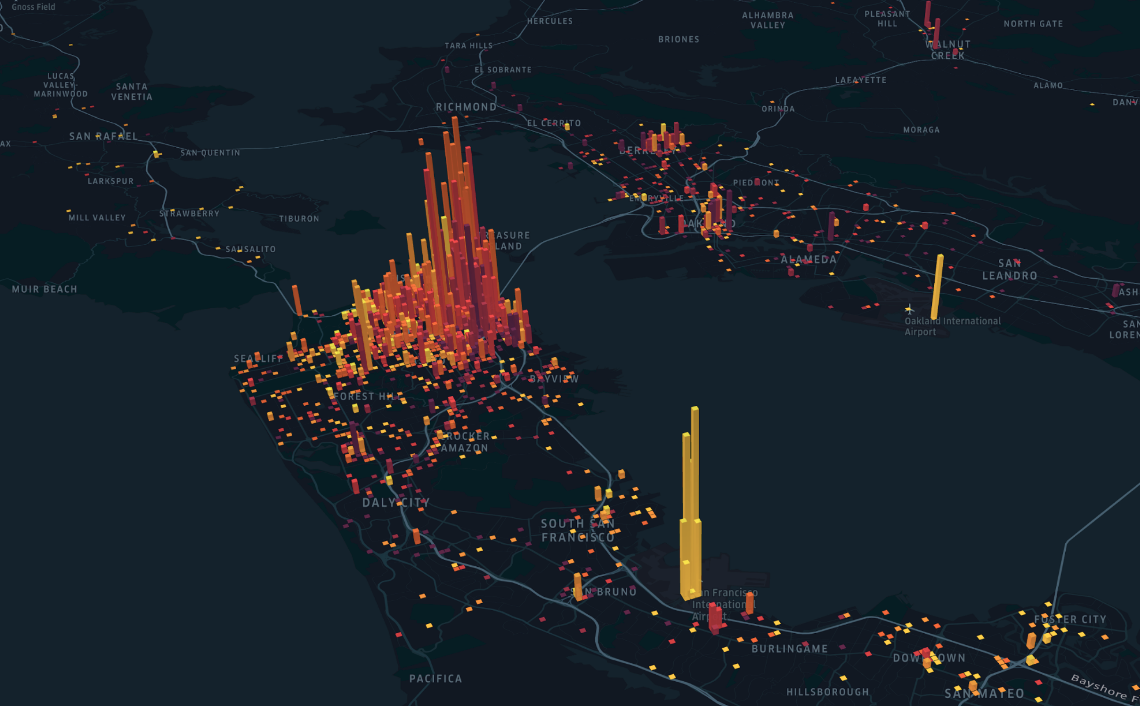
What truly sets Kepler.gl apart is its ability to transform raw data into compelling narratives. Each visualization is more than a technical representation – it‘s a story waiting to be understood.
When you explore a heat map of customer movements or track delivery routes, you‘re not just seeing numbers. You‘re witnessing human behavior, economic patterns, and societal dynamics.
Conclusion: A New Era of Accessible Location Intelligence
Kepler.gl represents more than a technological tool. It‘s a democratizing force that breaks down barriers between complex data and human understanding.
Whether you‘re a researcher, business analyst, urban planner, or simply curious about the world around you, Kepler.gl offers an unprecedented window into location-based insights.
The future of data visualization is not about complexity – it‘s about accessibility, understanding, and the stories hidden within our geographical data.
Your Next Steps
- Explore the official Kepler.gl GitHub repository
- Download sample datasets
- Experiment and discover
- Join the global community of geospatial innovators
The journey of understanding begins with a single visualization.