Unraveling Data Dispersion: A Journey Through Statistical Landscapes
The Data Detective‘s Manifesto
Picture yourself as a data detective, armed with nothing more than a collection of numbers and an insatiable curiosity. Your mission? To understand the hidden stories lurking within seemingly mundane datasets. Welcome to the fascinating world of data dispersion.
A Personal Prelude
My journey into statistical analysis began in a cramped university laboratory, surrounded by stacks of punch cards and early computational machines. Back then, understanding data wasn‘t just about numbers—it was about uncovering narratives hidden between decimal points.
The Evolution of Dispersion Techniques
Historical Foundations
Long before sophisticated algorithms and machine learning, statisticians grappled with understanding data variability. The concept of dispersion emerged from humanity‘s fundamental desire to make sense of complexity.
In the late 19th century, mathematicians like Francis Galton began exploring how data points deviate from central tendencies. Their pioneering work laid the groundwork for modern statistical methods, transforming how we perceive numerical information.
Diving Deep: Range – The Simplest Storyteller
Imagine range as the most straightforward narrator in our data story. It speaks through a single, uncomplicated metric: the distance between the highest and lowest values.
[Range = Maximum Value – Minimum Value]While seemingly basic, range provides an immediate snapshot of data spread. However, like a novice storyteller, it can be dramatically influenced by extreme values, potentially misrepresenting the broader narrative.
Real-World Range Scenarios
Consider temperature recordings in a research station. A range of 50 degrees might suggest significant variability, but it doesn‘t reveal the nuanced temperature fluctuations throughout the day.
Interquartile Range (IQR): The Robust Interpreter
IQR represents a more sophisticated storytelling technique. By focusing on the middle 50% of data, it creates a resilient framework for understanding variability.
[IQR = Q3 – Q1]The Quartile Symphony
Imagine dividing your dataset into four equal sections. Q1 represents the 25th percentile, while Q3 represents the 75th. The space between them—the IQR—becomes a powerful lens for understanding data distribution.
Outlier Detection Magic
[Outlier Boundaries = [Q1 – 1.5 IQR, Q3 + 1.5 IQR]]This formula becomes a detective‘s magnifying glass, revealing data points that deviate significantly from the norm.
Variance: Mathematical Poetry in Motion
Variance transforms raw numbers into a mathematical symphony, quantifying how data points dance around the mean.
Population Variance Exploration
[\sigma^2 = \frac{\sum_{i=1}^{N} (x_i – \mu)^2}{N}]Each squared deviation becomes a note in our statistical composition, revealing the intricate relationships within datasets.
Standard Deviation: Bringing Clarity to Complexity
Standard deviation acts as a translator, converting the squared language of variance back into comprehensible units.
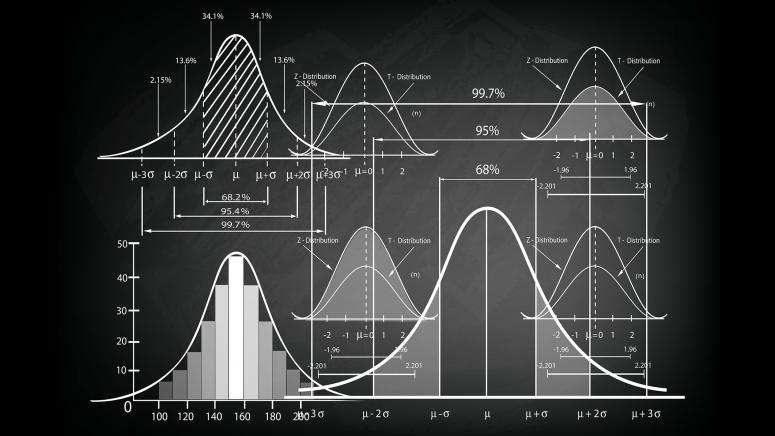
[\sigma = \sqrt{\frac{\sum_{i=1}^{N} (x_i – \mu)^2}{N}}]The Normal Distribution Waltz
In the elegant dance of normal distribution:
- 68% of values pirouette within one standard deviation
- 95% twirl within two standard deviations
- 99.7% perform their intricate routine within three standard deviations
Machine Learning: The Modern Data Interpretation Frontier
Modern data science transcends traditional statistical boundaries. Machine learning algorithms leverage dispersion techniques to preprocess, understand, and predict complex datasets.
Preprocessing Strategies
Different dispersion methods serve unique preprocessing needs:
- IQR shines with skewed distributions
- Standard deviation excels in normally distributed data
- Range provides quick, initial insights
Computational Considerations and Performance
Understanding dispersion isn‘t just about mathematical elegance—it‘s about computational efficiency and algorithmic sophistication.
Algorithmic Complexity
Each dispersion technique carries distinct computational characteristics, influencing performance in large-scale data analysis.
The Future of Statistical Understanding
As computational power grows and machine learning techniques evolve, our approach to understanding data variability continues to transform.
Emerging research explores:
- Robust statistical methodologies
- Advanced machine learning preprocessing techniques
- Interdisciplinary data interpretation strategies
Conclusion: Beyond Numbers
Data dispersion represents more than mathematical calculations. It‘s a profound method of understanding complexity, uncovering hidden patterns, and transforming raw information into meaningful insights.
As you continue your journey through the statistical landscape, remember: every number tells a story, and dispersion techniques are your trusted translators.
A Final Reflection
In the words of a seasoned data detective: "Embrace the variability, for within the spread lies the true essence of understanding."