Unveiling Folium: A Masterclass in Creating Web Maps from Data
The Forgotten Art of Geographical Storytelling
Imagine standing before an ancient map, tracing your fingers across intricate coastlines and mysterious territories. Maps have always been more than mere geographical representations—they‘re windows into human understanding, narratives of exploration, and portals to understanding complex spatial relationships.
In our digital age, the art of mapping has transformed dramatically. No longer confined to parchment and ink, modern mapping technologies like Folium have revolutionized how we perceive, analyze, and interact with geographical data.
The Evolutionary Journey of Geospatial Visualization
Geographical representation isn‘t a recent phenomenon. From Babylonian clay tablets to medieval portolan charts, humans have been obsessively documenting spatial information for millennia. What‘s changed is our computational capability to transform raw data into interactive, dynamic visualizations.
Folium emerges as a sophisticated Python library that bridges traditional cartography with cutting-edge data science. It‘s not just a tool; it‘s a storytelling platform that allows researchers, developers, and analysts to breathe life into geographical datasets.
Understanding Folium‘s Architectural Brilliance
At its core, Folium is a Python wrapper around Leaflet.js, a powerful JavaScript mapping library. This architectural design allows seamless translation between Python‘s data manipulation prowess and JavaScript‘s interactive rendering capabilities.
Consider Folium as a linguistic translator between two complex programming dialects. Python provides the structured data and computational logic, while Leaflet.js transforms these instructions into visually compelling, interactive web maps.
The Technical Symphony of Mapping
When you create a map using Folium, multiple technological components dance in perfect synchronization:
- Data Preprocessing: Python libraries like Pandas and GeoPandas clean and structure your geographical data
- Coordinate Translation: Latitude and longitude are converted into pixel coordinates
- Tile Rendering: Map tiles are fetched from various providers like OpenStreetMap
- Interactive Layer Generation: Markers, polygons, and overlays are dynamically created
- JavaScript Compilation: Python instructions are translated into interactive web map code
Real-World Mapping Scenarios
Environmental Conservation Mapping
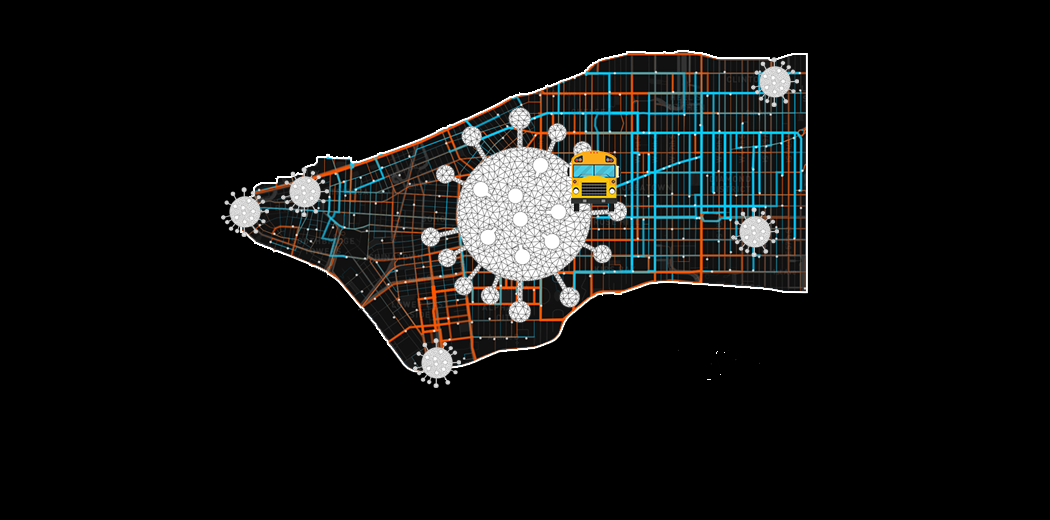
Imagine tracking endangered species migration patterns. Traditional methods involved manual data collection and static visualizations. Folium transforms this process by enabling real-time, interactive tracking.
A marine biologist can now create a map showing whale migration routes, with each point representing tracked individuals. Users can zoom, click, and explore detailed information about each tracked whale, turning complex scientific data into an engaging narrative.
Urban Planning and Infrastructure Development
City planners leverage Folium to visualize complex infrastructure projects. By overlaying demographic data, transportation networks, and proposed development zones, they can make data-driven decisions that impact thousands of lives.
Advanced Mapping Techniques
Choropleth Mapping: Painting Data with Colors
Choropleth maps represent statistical information through color gradients. Folium makes creating these maps incredibly intuitive. Imagine visualizing population density, where deeper colors represent higher population concentrations.
import folium
import geopandas as gpd

# Load geographical boundaries
world_map = gpd.read_file(gpd.datasets.get_path(‘naturalearth_lowres‘))

# Create interactive choropleth
m = folium.Map(location=[0, 0], zoom_start=2)
folium.Choropleth(
    geo_data=world_map,
    name=‘Population Density‘,
    data=population_dataset,
    columns=[‘Country‘, ‘Density‘],
    key_on=‘feature.properties.name‘,
    fill_color=‘YlOrRd‘
).add_to(m)
Time-Series Geospatial Visualization
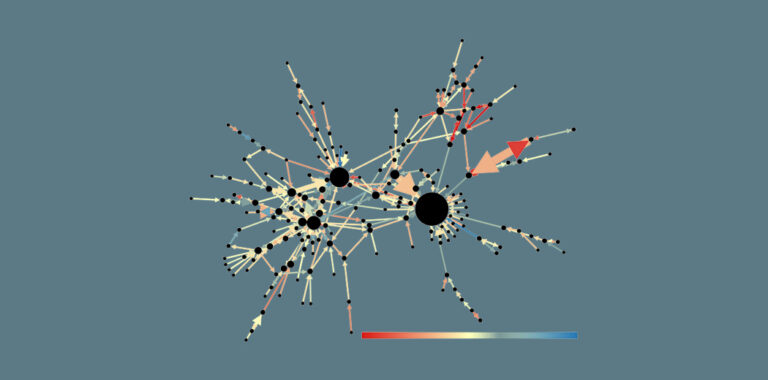
Folium‘s plugins like HeatMapWithTime allow dynamic representation of data evolution. Researchers can now show how phenomena like disease spread, traffic patterns, or climate changes occur over time.
Machine Learning and Geospatial Intelligence
The convergence of machine learning with geospatial visualization opens unprecedented analytical possibilities. Predictive models can now generate maps that not only represent current data but forecast future scenarios.
Consider a climate change prediction model that uses historical geographical data to project potential environmental transformations. Folium becomes the canvas where complex machine learning algorithms paint their predictive insights.
Ethical Considerations in Geospatial Visualization
With great visualization power comes significant responsibility. Geospatial data can reveal sensitive information about populations, territories, and individual movements.
Responsible mapping requires:
- Anonymizing personal data
- Obtaining proper geographical data permissions
- Transparent visualization methodologies
- Avoiding potential misuse of spatial information
The Future of Geospatial Visualization
As artificial intelligence and machine learning continue evolving, geospatial visualization will become increasingly sophisticated. We‘re moving towards:
- Real-time, AI-driven map generation
- Predictive geographical modeling
- Immersive, three-dimensional mapping experiences
- Enhanced privacy-preserving visualization techniques
Practical Recommendations for Aspiring Geospatial Experts
- Master Python and its data science ecosystem
- Understand geographical coordinate systems
- Learn JavaScript for advanced interactive features
- Stay updated with emerging mapping technologies
- Practice, experiment, and never stop exploring
Conclusion: Maps as Living, Breathing Narratives
Folium isn‘t just a library—it‘s a storytelling platform that transforms raw geographical data into compelling, interactive narratives. Whether you‘re a researcher, developer, or curious explorer, Folium offers a powerful lens to understand our complex, interconnected world.
As you embark on your geospatial visualization journey, remember: every map tells a story. Your task is to listen, understand, and share that story with the world.