Mastering Stock Exchange Dashboards: A Comprehensive Guide to Dash in Python
The Evolution of Financial Data Visualization
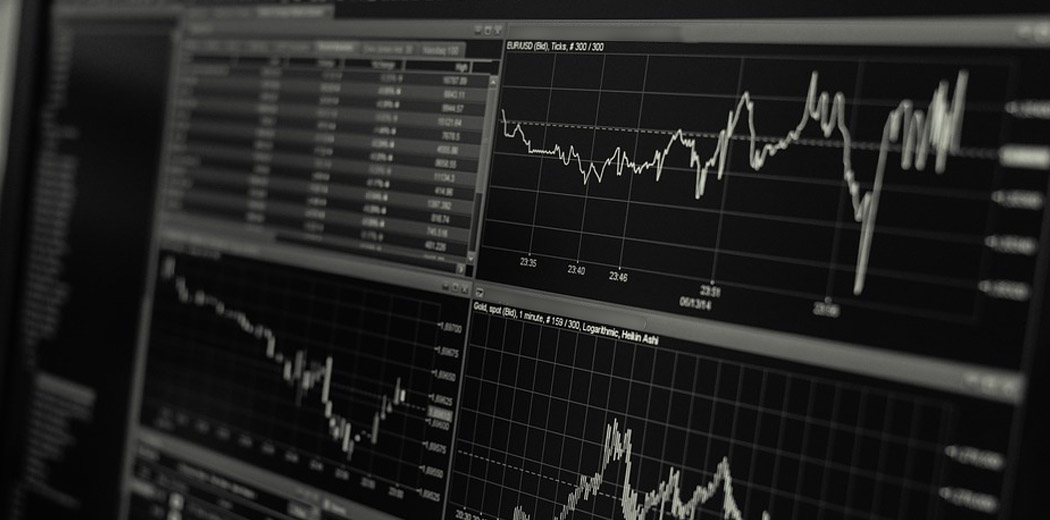
Imagine standing in a bustling trading floor decades ago, surrounded by endless paper charts, manual calculations, and frantic traders. Today, we‘ve transformed that chaotic environment into elegant, intelligent digital dashboards powered by cutting-edge technologies like Python‘s Dash framework.
The Journey of Financial Data Representation
Financial data visualization has undergone a remarkable transformation. From hand-drawn stock charts to complex, interactive digital dashboards, technology has revolutionized how we understand and interact with market information.
Why Modern Dashboards Matter
In the rapidly changing world of financial technology, dashboards are no longer just visual representations—they‘re sophisticated analytical tools that provide instant insights, predictive capabilities, and seamless data exploration.
Understanding Dash: More Than Just a Visualization Tool
Dash isn‘t merely a charting library; it‘s a comprehensive framework that bridges data science, web development, and financial analysis. By combining Plotly.js, Flask, and React.js, Dash creates a powerful ecosystem for building interactive financial dashboards.
Technical Architecture of Dash
When you dive into Dash‘s architecture, you‘ll discover a meticulously designed system that allows developers to create complex, responsive dashboards with minimal web development knowledge. The framework abstracts away intricate web technologies, allowing data scientists to focus on what they do best: analyzing data.
Preparing Your Development Environment
Setting up a robust development environment is crucial for building sophisticated stock exchange dashboards. Let‘s walk through a comprehensive setup that ensures a smooth development experience.
Virtual Environment Configuration
# Create and activate virtual environment
python -m venv stock_dashboard_env
source stock_dashboard_env/bin/activate  # Unix-based systems
# stock_dashboard_env\Scripts\activate  # Windows

# Install essential libraries
pip install dash pandas plotly numpy scikit-learn
Advanced Dashboard Design Principles
Data Preprocessing and Transformation
Before visualizing stock data, robust preprocessing becomes critical. Consider implementing sophisticated techniques that go beyond simple data loading:
import pandas as pd
import numpy as np

def preprocess_stock_data(dataframe):
    """
    Advanced stock data preprocessing function

    Args:
        dataframe (pd.DataFrame): Raw stock price dataset

    Returns:
        pd.DataFrame: Processed and feature-engineered dataset
    """
    # Calculate technical indicators
    dataframe[‘SMA_50‘] = dataframe[‘Close‘].rolling(window=50).mean()
    dataframe[‘SMA_200‘] = dataframe[‘Close‘].rolling(window=200).mean()

    # Compute volatility
    dataframe[‘Daily_Return‘] = dataframe[‘Close‘].pct_change()
    dataframe[‘Volatility‘] = dataframe[‘Daily_Return‘].rolling(window=30).std()

    return dataframe
Implementing Intelligent Callbacks
Dash‘s callback mechanism allows for dynamic, responsive dashboards. Here‘s an advanced implementation:
@app.callback(
    Output(‘stock-chart‘, ‘figure‘),
    [Input(‘date-range‘, ‘start_date‘),
     Input(‘date-range‘, ‘end_date‘),
     Input(‘stock-selector‘, ‘value‘)]
)
def update_stock_chart(start_date, end_date, selected_stocks):
    """
    Dynamically update stock chart based on user interactions

    Args:
        start_date (str): Selected start date
        end_date (str): Selected end date
        selected_stocks (list): List of selected stock tickers

    Returns:
        dict: Plotly figure configuration
    """
    filtered_data = data[
        (data[‘Date‘] >= start_date) &
        (data[‘Date‘] <= end_date) &
        (data[‘Ticker‘].isin(selected_stocks))
    ]

    # Create multi-line chart with advanced styling
    traces = [
        {
            ‘x‘: stock_data[‘Date‘],
            ‘y‘: stock_data[‘Close‘],
            ‘type‘: ‘line‘,
            ‘name‘: ticker
        } for ticker, stock_data in filtered_data.groupby(‘Ticker‘)
    ]

    layout = {
        ‘title‘: ‘Stock Performance Comparison‘,
        ‘xaxis‘: {‘title‘: ‘Date‘},
        ‘yaxis‘: {‘title‘: ‘Closing Price‘}
    }

    return {‘data‘: traces, ‘layout‘: layout}
Machine Learning Integration
Predictive Analytics in Dashboards
Modern dashboards aren‘t just about visualization—they‘re about prediction. Integrating machine learning models directly into your Dash application can provide unprecedented insights.
from sklearn.preprocessing import StandardScaler
from sklearn.model_selection import train_test_split
from sklearn.ensemble import RandomForestRegressor

def train_stock_prediction_model(data):
    """
    Train machine learning model for stock price prediction

    Args:
        data (pd.DataFrame): Historical stock price dataset

    Returns:
        sklearn.ensemble.RandomForestRegressor: Trained prediction model
    """
    features = [‘Open‘, ‘High‘, ‘Low‘, ‘Volume‘]
    target = ‘Close‘

    X = data[features]
    y = data[target]

    X_train, X_test, y_train, y_test = train_test_split(X, y, test_size=0.2)

    scaler = StandardScaler()
    X_train_scaled = scaler.fit_transform(X_train)

    model = RandomForestRegressor(n_estimators=100)
    model.fit(X_train_scaled, y_train)

    return model, scaler
Performance Optimization Strategies
Handling Large Datasets
When working with extensive financial datasets, performance becomes paramount. Consider implementing:
- Data sampling techniques
- Efficient pandas operations
- Caching mechanisms
- Asynchronous data loading
Future of Financial Dashboards
The future of stock exchange dashboards lies in seamless integration of artificial intelligence, real-time data processing, and intuitive user experiences. As technologies evolve, expect dashboards to become more predictive, personalized, and intelligent.
Emerging Trends
- AI-powered predictive analytics
- Real-time machine learning model updates
- Enhanced interactive visualization techniques
- Personalized financial insights
Conclusion
Building sophisticated stock exchange dashboards using Dash represents the convergence of data science, web technologies, and financial analysis. By mastering these techniques, you‘re not just creating a visualization tool—you‘re building an intelligent financial companion.